Live Wavefront Aberration Reporting
Turns a Shack–Hartmann measurement into a report a person can read — Zernike terms, PSF, Strehl across pupil sizes, and the moon as that eye actually sees it.
- When
- Summer 2026
- Role
- Reporting and group-analysis layers on WFLIVE, with Austin Roorda
- Status
- complete
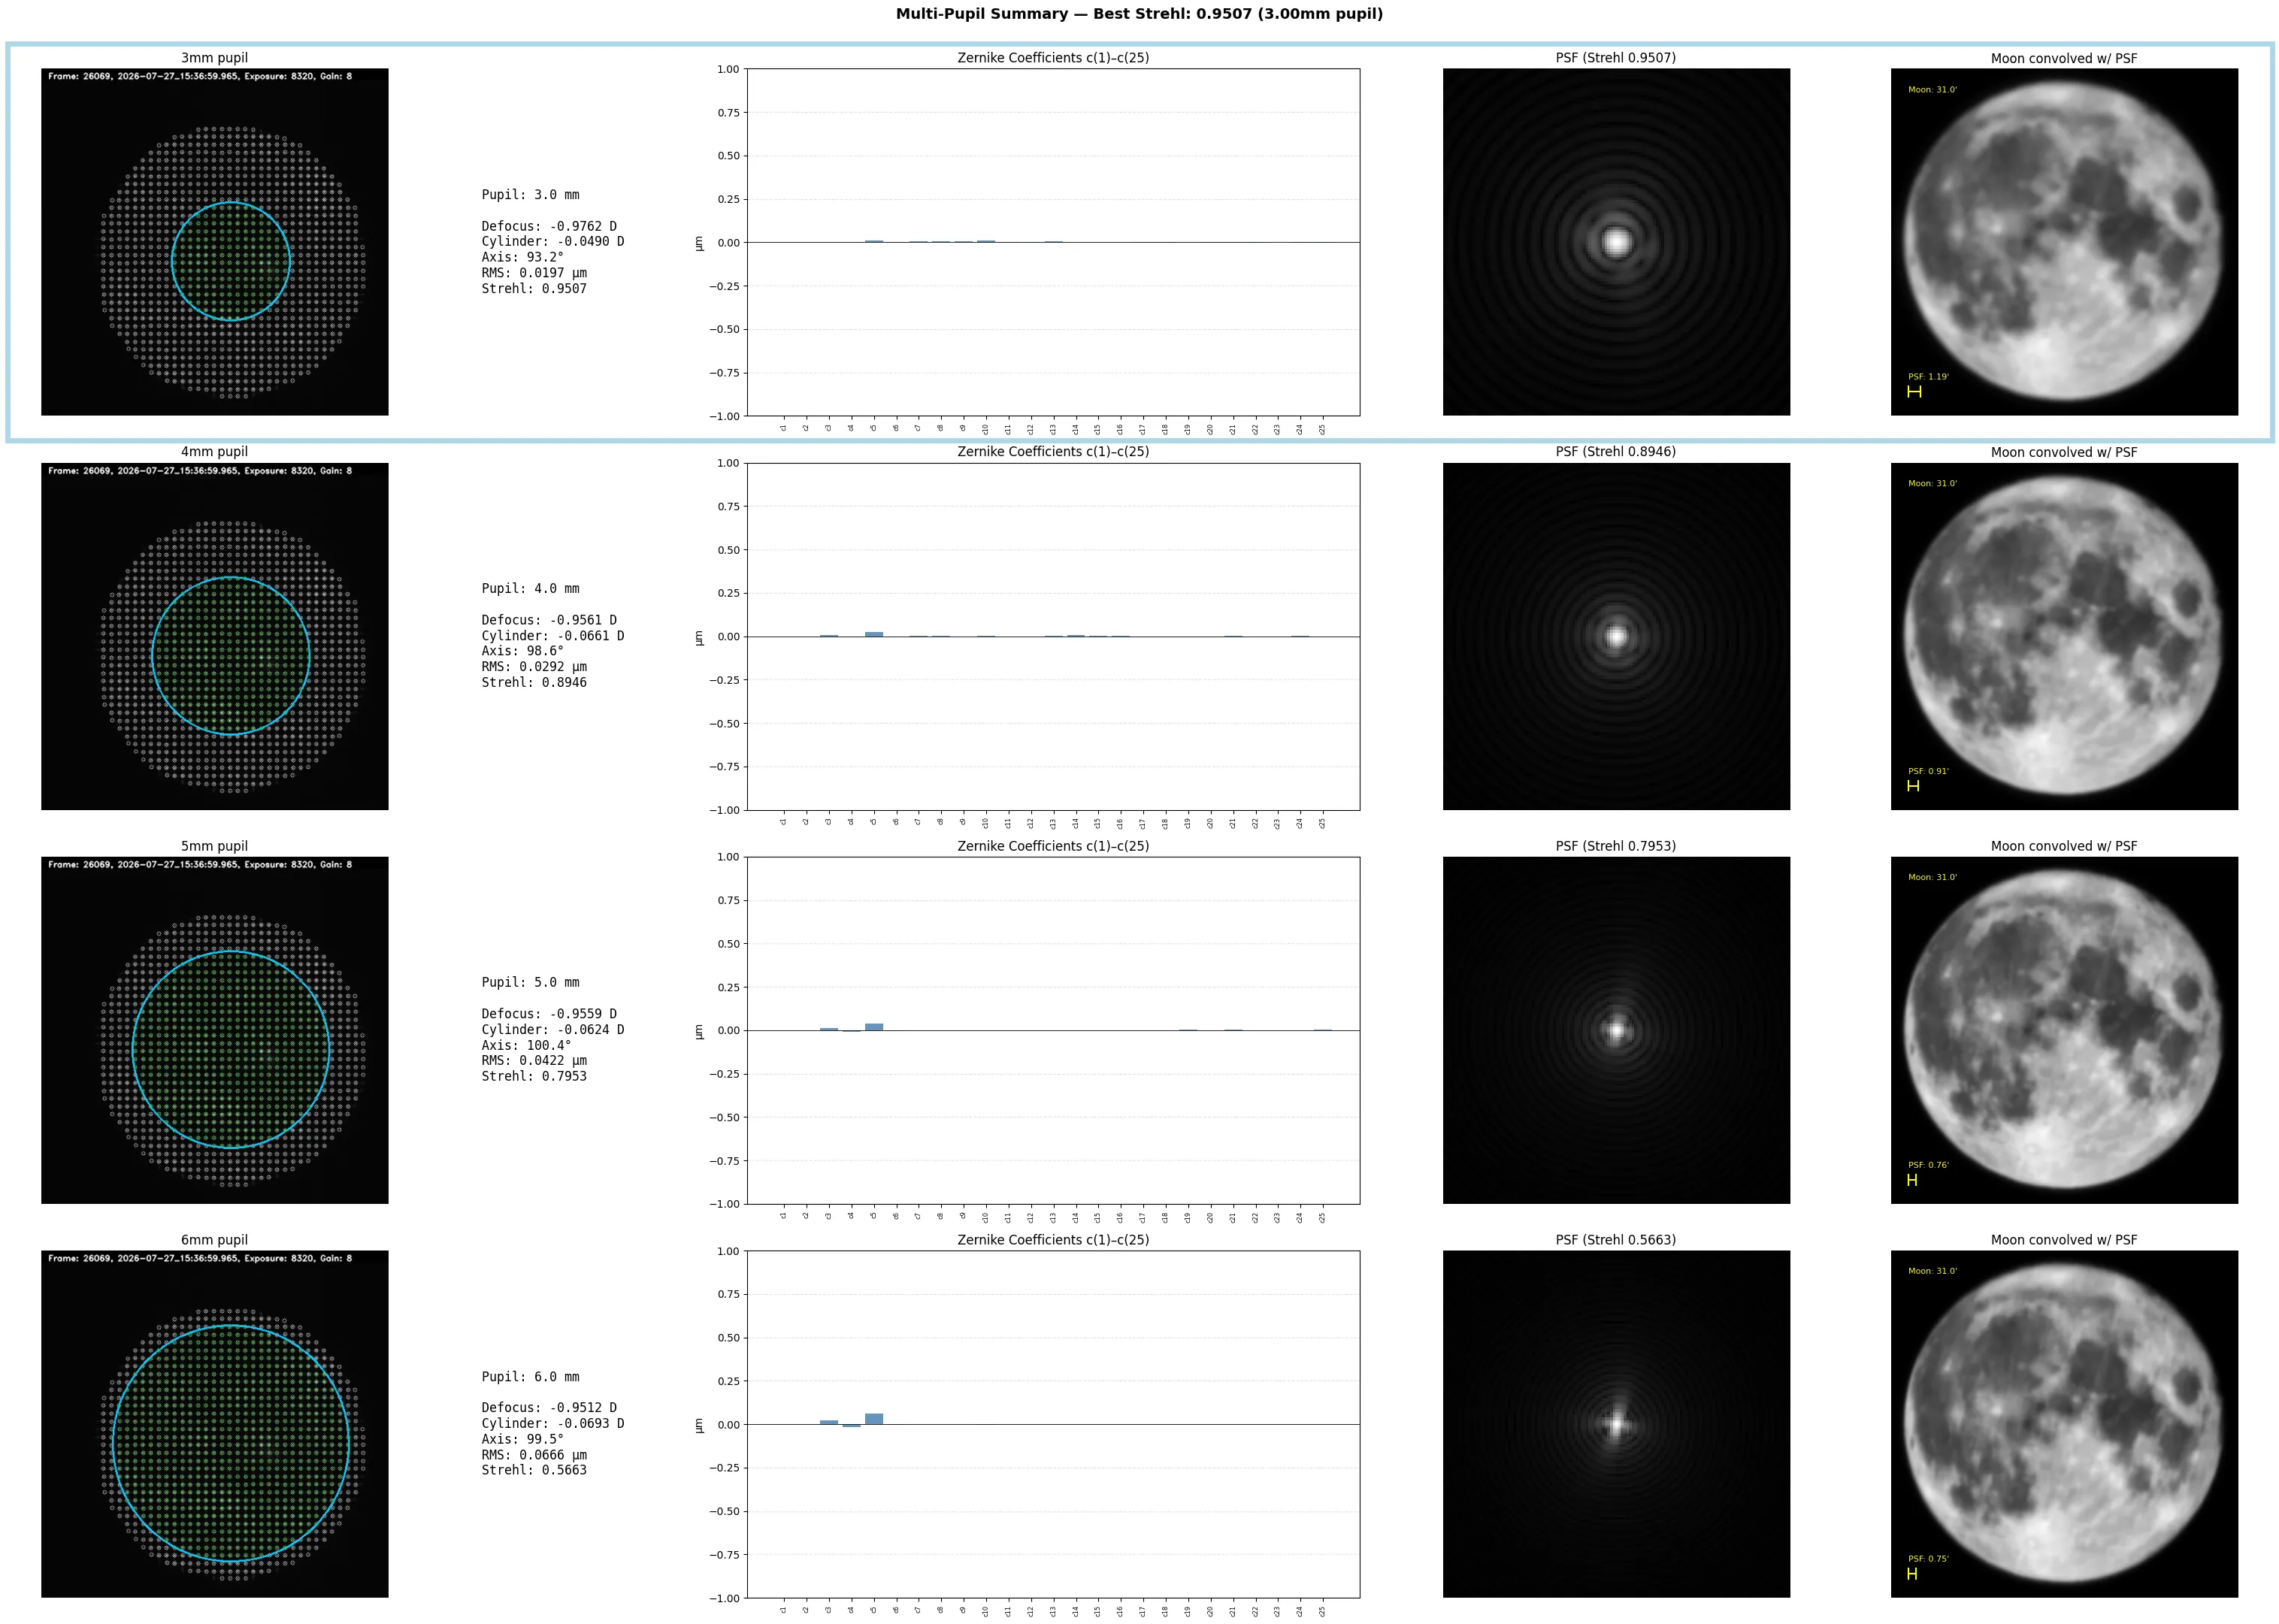
A Shack–Hartmann sensor returns a list of Zernike coefficients — exact, and almost unreadable. This turns one capture into a report a person can look at.
What it Generates
A multi-pupil summary: one row per pupil size, all from the same frame, so the rows are directly comparable. Each row has the centroid fit, the refraction (defocus, cylinder, axis), RMS, Strehl, Zernike coefficients c1–c35, the PSF at arcminute scale, and the moon convolved with that PSF. Best-Strehl row highlighted in blue.
The Moon
Strehl 0.31 means nothing to a non-optics person. The moon smeared the way their own eye smears it lands immediately. Scaled to the moon’s real angular diameter of 1860 arcseconds, so the convolution is in true angular units.
Under the Hood
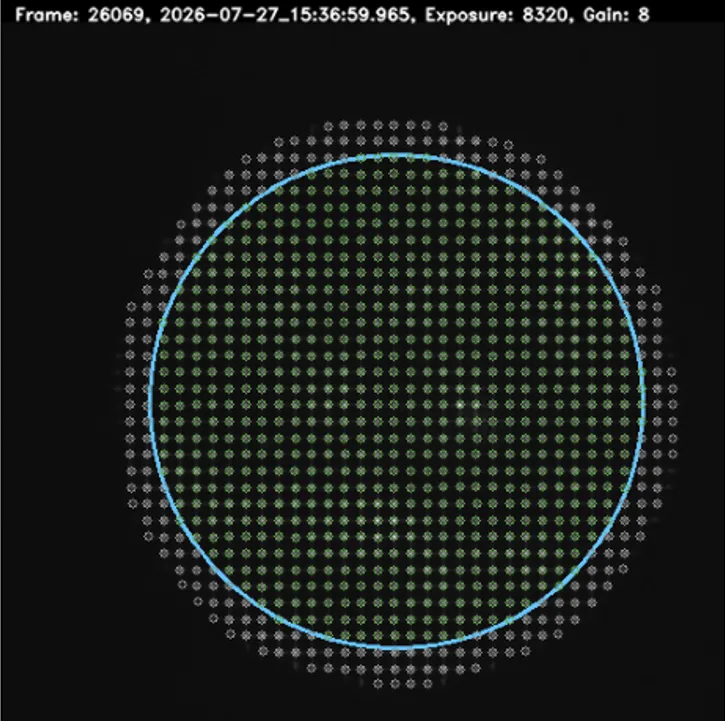
Python, layered on WFLIVE, the live Shack–Hartmann application that handles camera acquisition and per-frame wavefront reconstruction. The reporting and group analysis are mine.
Numba-compiled Zernikes. PSFs by FFT on a 256-pixel pupil grid at 8× field oversampling. Through-focus Strehl sweeps defocus to find best focus, with a dioptre ↔ c4 converter so refraction and wavefront terms stay consistent. Lenslets are 0.15 mm at 5.2 mm focal length, 5.86 µm per pixel through 0.75×. Imaging at 840 nm, reporting at 555 nm with optional chromatic defocus correction. Individual terms can be excluded, to show an eye with and without its own defocus and astigmatism. Two cameras — FLIR on the sensor, IDS on the pupil — plus a serial interface for the lasers and LEDs.
Group Data
Captures accumulate into a per-group JSON keyed by participant and eye, with a snapshot of every analysis parameter so a report can be reproduced. A separate pass bins the group by pupil size (3–8 mm), computes RMS statistics, and separates higher-order terms from low-order refraction.
At the AO Summer Conference
Ran at UC Santa Cruz, August 2026. I set up the instrument, installed the software, and measured attendees. Each person got their own report; the group data became the closing presentation.